Effect of exericse on basal insulin rate in type 1 diabetes
Introduction
In Type 1 diabetes, exercise has an effect on blood glucose levels. In general, during periods of low to moderate intensity exercise, blood glucose levels will drop. To counteract this, either insulin is reduced or carbohydrate intake is increased. Moreover, it is often reported that this effect may last for up to 24 hours post-exercise.
I have type I diabetes and in my case, exercise has a much bigger and more cumulative effect on insulin levels – I might have to reduce basal insulin by as much as 40% in the weeks following exercise. Conversely, when exercise is stopped, my basal insulin requirements will increase over the following week, back to previous levels.
I adjust basal insulin during periods of changing exercise levels by recording blood glucose levels and changing basal insulin accordingly – for instance if blood glucose levels are too high over a period of 12-24 hours, basal insulin is increased. Ie, the measured variable is blood glucose and insulin is varied to keep this within normal limits (this is a simplification of the process as it assumes that incorrect basal rate is the only reason for out-of-range glucose levels. In practice there are many other contributing factors). During the period of this reactive adjustment, blood glucose levels are therefore either too high or too low, both of which are very detrimental to health.
The aim of this experiment is to quantify the relationship between exercise and basal insulin rate with the ultimate aim of allowing basal insulin to be adjusted proactively rather than reactively, keeping blood glucose levels within normal limits for longer periods and improving the long-term health prospects of individuals with diabetes.
The experiment captured heart rate data during exercise and insulin data from an insulin pump over several months. As expected, the results showed a decrease in insulin in the days proceeding exercise and an increase once exercise had been stopped, however, the quantification of this effect was not achieved. Several recommendations for ways to improve the experiment were made.
Method
Exercise data
Heart rate data was obtained using a Garmin HRM strap paired with a Garmin Edge 500 cycle computer or a Garmin FR70 watch (depending on the exercise taking place). The data was recorded whenever exercise was done. In this experiment, the definition of exercise included running, cycling, circuit training and strength training. Notably, heart rate data was not captured for day-to-day activities such as walking. After each exercise session, data was uploaded to Strava. Software was written to connect to Strava via their API and download the activities as CSV files. Details of this process are provided elsewhere.
To quantify exercise, two TRIMP (TRaining IMPulse) numbers were calculated for each exercise session – one based on heart rate and one based on total exercise duration. These numbers were calculated on a daily basis.
Insulin data
An Animas Vibe insulin pump was used for continuous subcutaneous insulin infusion (CSII). Periodically data from the pump was uploaded to the Diasend website. This allowed the insulin data to be viewed and exported as an Excel file. The Excel file was processed into CSV files containing the insulin data. Details of this process are provided in another post. The total basal insulin dose was recorded.
Data Analysis
Data analysis was performed using R. The R scripts were used to calculate total basal dose and TRIMP from the raw pump and heart rate data and to plot graphs. The R scripts are in GitHub, here.
Results
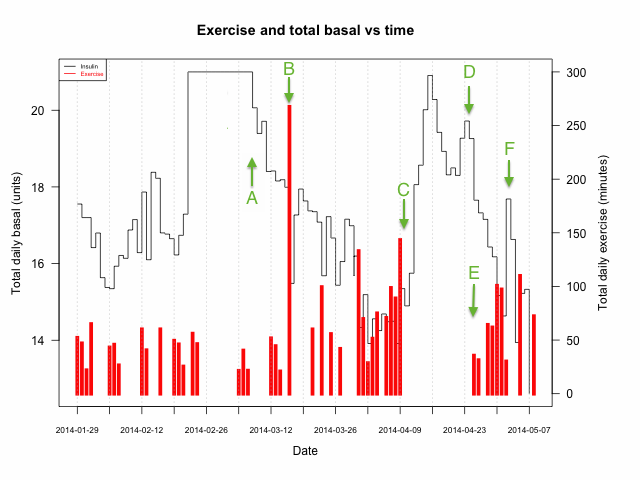
The calculated daily TRIMP and insulin data can be found on GitHub, here. Figure 1 below shows some interesting features in this data. For clarity only the TRIMP (duration) data was shown. A comparison of different TRIMP calculation methods will be made in a subsequent article.
Discussion
In this experiment, the expected reduction in basal rate with increasing exercise, and also increase in basal rate when exercise is stopped, can be seen. For instance between points A and C, exercise takes place regularly and there is a general decrease in basal insulin rate. At point C exercise stops, and there is a corresponding rise in basal insulin rate. exercise starts again at point E and there is a fall in basal insulin rate. At point F, exercise stops, and there is a rise in basal insulin rate.
However there are are a number of features which will make quantification of this effect difficult. The rest of this section discusses these issues and makes recommendations for future improvements.
Missing basal rate data
In figure 1, in the two weeks prior to point A the basal rate is shown as fixed at 21u/day. The author knows this to be incorrect. Through discussion with Diasend, this feature was explained by a 270-point limit on the number of basal rate changes that the pump can store. If there are more than 270 basal changes since the last pump upload, the basal rate is reported as the last basal rate processed.
Completeness of exercise data
Not all activity data is captured. Only periods of strenuous activity were captured but other activities were not captured. For instance, weekends may be more sedentary than weekdays in a busy office, or weekends may involve a long walk. Both of these factors are not catered by the heart rate data but may be significant.
Correlation against actual, not required, basal rate
There is a lag between the recorded basal rate and the basal rate required to stay within normal glucose range, while the basal rate is adjusted. For instance when exercise is stopped, after approximately one day, blood glucose readings will start to rise. This is an indication that basal insulin levels should also be increased to keep glucose levels within range. However, it can take 12-24 hours for the correct basal rate to be obtained. If exercise does not recommence, glucose levels will continue to rise over several days (as shown at point C on figure 1). During this time the basal rate will continue to be increased. The author estimates this gives rise to an approximate lag of one day between the actual basal rate and the required basal rate to keep blood glucose levels within range.
Reduced basal during exercise
The basal rate may be temporarily reduced during periods of exercise. For instance during exercise sessions longer than 3h, the basal rate may be reduced by 50% (see point B on figure 1). This is a consequence of the exercise activity being performed at that time an not as a result of exercise performed in the preceding days. Inclusion of this lowered basal rate may negatively affect the correlation.
Changes in basal rate due to other factors
There may be other reasons why basal rates need adjusting. For instance, illness can give rise to increased insulin requirements. However, as illness and inactivity usually go hand in hand, the effects of illness may be conflated with those of inactivity and it may be hard to separate the two effects. On figure 1, exercise at point C was stopped due to illness – the subsequent rise in basal rate may be due to a combination of illness and lack of exercise.
At point D, basal insulin increased again – it is not known why. Some other event may have taken place but this was not recorded. A facility to record notes would be useful so that commentary may be recorded at the time.
Recommendations for future experiments
The following points address some of the issues discussed above:
- Upload pump data more frequently to Diasend to prevent hitting the 270-point basal rate limit. If there are 5 basal rate changes per day, this implies that pump data should be uploaded no less frequently than once per 54 days.
- Capture all activity data, rather than just periods of strenuous activity. Capturing only strenuous activity may discard data which is required to describe basal rate changes.
- Build a model to generate an estimate of basal rate required to stay in normal glycemic range, based on bolus insulin, corrective carbohydrates blood glucose levels. It is correlation of this proxy basal rate with exercise which is actually required.
- Source and correct for temporary basal rate changes while involved in an activity.
- Mark periods of illness so that any increase in basal rate due to illness may be discounted from analysis.
- Record commentary which may be useful in explaining interesting or unexpected data.
Conclusion
The data shows a relationship between exercise and basal insulin rate but also highlights a number of deficiencies in the collected data. The experiment has identified a number of areas to improve data quality which will be implemented in a follow-up experiment. The experiment also highlights the possibilities for individuals to better understand their heath conditions through quantification using modern technologies such as Strava.