Data visualisation - the Guardian Masterclass
I spend a lot of time at work trying to get people to make decisions based on data I generate. The business people I present to have a lot on their mind and anything more than a single page presentation is unlikely to get any attention. Which means that the single page you do present has to be attention grabbing, concise and relevant.
Enter Data Visualisation. You’ve probably seen info graphics like the one below. They are terribly popular these days.
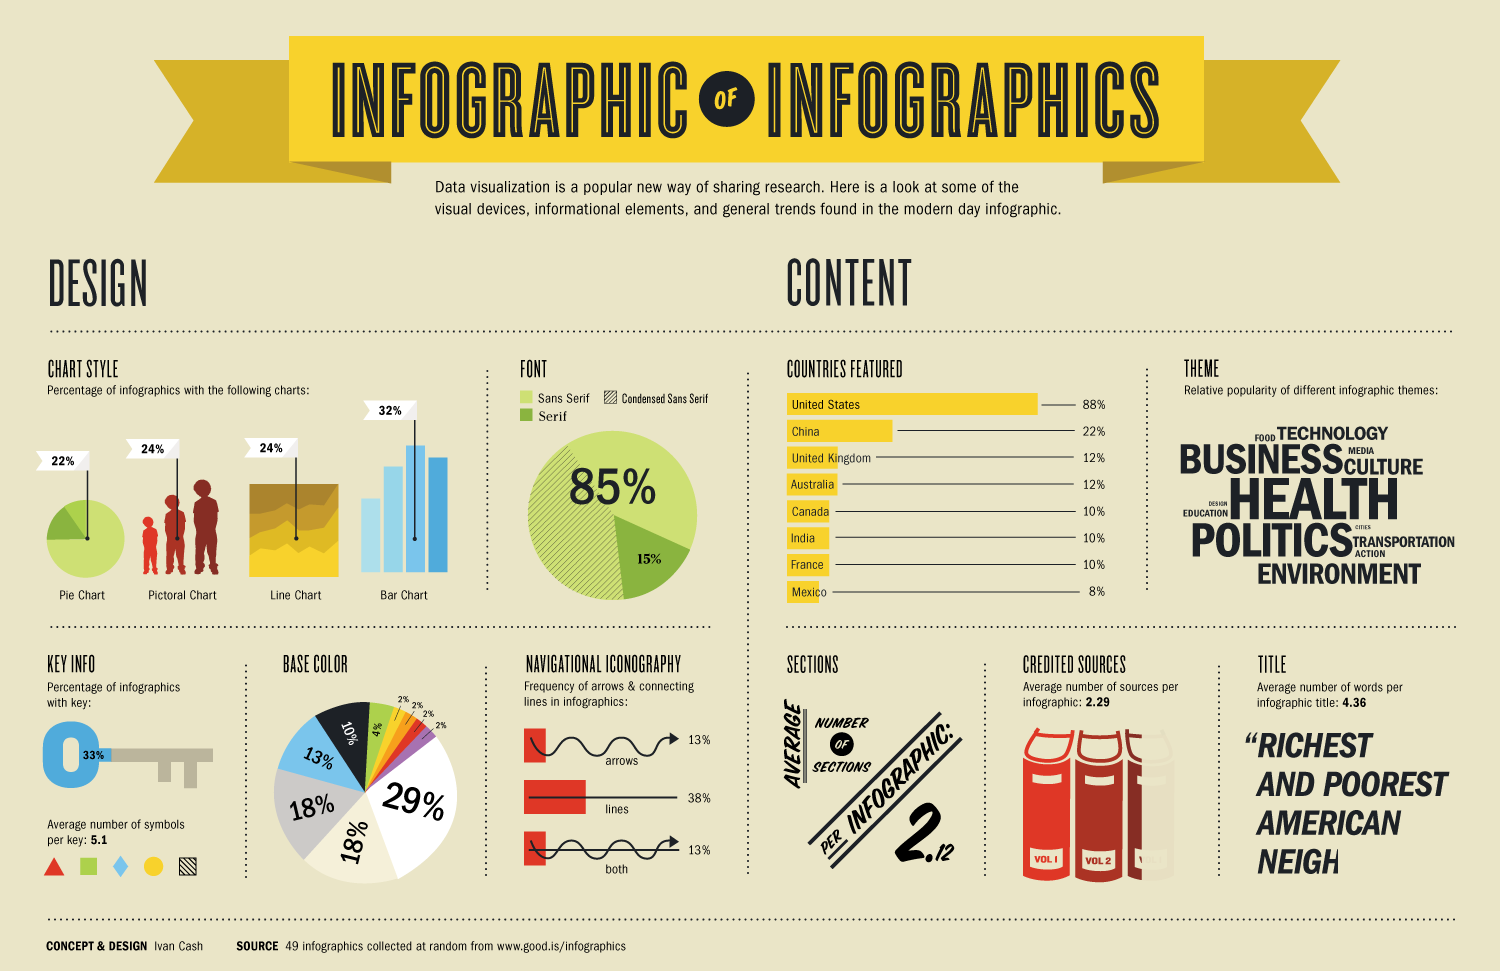
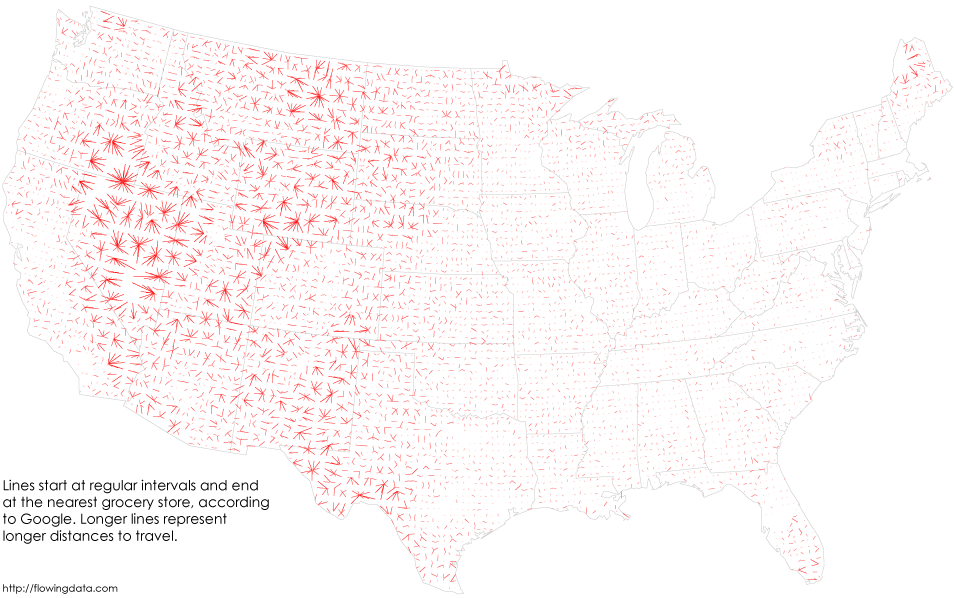
But while those sort of infographics are good for grabbing the attention, they really come into their own when you want to convey trends in large data sets, visually. This is what i’m more interested in. Like this one:
So to find out more about data visualisation I went on a data visualisation course run by the Guardian Digital Agency. It was excellent. Lots of practical tools and tips for turning large data sets into something which is visually digestible as well as links to some great blogs with amazingly beautiful visualisations.
Here are some of my favourites:
- http://www.informationisbeautiful.net/
- http://www.visualizing.org/
- http://flowingdata.com/
- http://visual.ly/